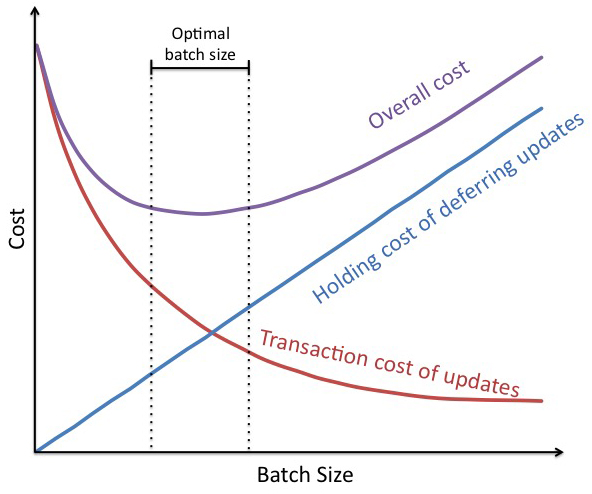
U-curve optimization
Used to determined the optimal batch size by balancing transaction cost and holding cost. A graph that has illustrates three quantities: transaction cost, holding cost, and total cost. The y-axis is cost, and the x-axis is batch size. By adding together the transaction cost and the holding cost for each batch size we can see the total cost for a given batch size. The goal is to determine the lowest total cost. U-curve optimizations have a “flat bottom” so we don't have be perfect in calculating the optimal size, there is a range of good batch sizes. See also transaction cost, holding cost.